APBR, the Association for Professional Basketball Research, is a forum where many of these talented individuals can discuss basketball statistical analysis, modeling, and best practices for acquiring and utilizing data. The forum is home to a passionate community which counts fans, consultants, service providers, and NBA personnel among its current and former active members.
Like last season, we put out an open call to APBR members to showcase their analytical draft projections. When making projections of any kind, aggregating information from a variety of sources tends to provide the best projection on average. Two esteemed APBR members, Nick Restifo and Jesse Fischer, have been nice enough to describe the method behind their personal NBA projections for this year's crop of prospects, show their top 14 picks, and then finally compare their 68 players with DraftExpress' mock draft. One thing to note is that these models aim to rank the best players, while our mock draft is an attempt to project where players might be drafted.
Note: Due to the varying levels of competition found in international basketball, only collegiate players were considered.
Preview on the Different NBA Draft Models, and Their Top Prospects. Full Ranking At Bottom
My name is Nick Restifo. In addition to working as an associate data scientist for a major company, I contribute to Nylon Calculus and Fansided, and consult for college basketball teams.
The first component of my draft projection system is an ensemble of a random forest model, and a gradient boosted logistic regression model, a logistic regression model, a neural network model, and a classification and regression decision tree, all predicting whether or not a player will play in the NBA. These models value factors like high school rank, points, strength of schedule, wingspan, and combine results more heavily than the other aspects of my system. My play probability models are trained on every player with a record on DraftExpress since 2002. These include almost all players in Division 1 basketball since then, as well as many players who played in international leagues across the world.
The next component of my draft model is an ensemble of a random forest model, and a gradient boosted regression model, a generalized linear regression model, a neural network model, and a classification and regression decision tree, all predicting success in the NBA assuming a player makes it that far. This production ensemble assigns similar influence to some factors when compared to the NBA play ensemble, but items such as age, steal rate, and assists carry the most weight here. Fewer variables are considered important enough to merit inclusion in the NBA production models. The combine test statistics, for example, do not make the cut. My NBA production models are trained on all NBA players who played more than a total of 50 minutes in at least one NBA season for which pre-draft information is available on DraftExpress since 2002.
While the target for the play probability models is simply whether or not a player played in the NBA, the target variable I train on and predict for the NBA production models is a player's two-year peak (in some cases one-year) of a scaled blend of NPI RAPM, WS, and BPM. Predicting WS alone actually results in the most accurate predictions from pre-draft production data, but since the ability to predict a number and the value of that prediction are two separate things, I opt to use the blend, combining the predictability of WS with the often more telling value of RAPM and BPM.
Both ensemble models are built on a weighted average, with each base model weighted in the ensemble by its ability to predict out of sample. To reach my overall rating, I simply take the success of a player should he play in the NBA to the power of his predicted probability of NBA play, making the process somewhat of an exercise in conditional probability. Taking the power as opposed to the product of these two values produced better out of sample results. While this approach may have flaws, it has undeniable flexibility. It can be applied without reliance on subjective filters for training or evaluation to any player playing in the major competitive basketball environments and provide a decent estimate of his value as a future NBA player.
My name is Jesse Fischer and I work at Amazon as a Senior Software Engineer. My academic background includes a degree in Computer Engineering with a minor in Mathematics from the University of Washington. I blog at [url=http://www.tothemean.comwww.tothemean.com as much as I can find time. If you haven't already, please check out our annual analytics draft board compilation (http://tothemean.com/tools/draft-models/, 2016 updates coming soon!). I can be found on twitter at @jessefischer33 (https://twitter.com/jessefischer33.
My "Longevity" draft model optimizes for "long term value" as defined by a player's max five-year "Value over Replacement Player" (VORP). VORP is based on the stat Box Plus/Minus (BPM) (link) and accounts for playing time, allowing injuries/durability/coaching preferences to be factored in, which is important when measuring for playing longevity. For active players, max VORP values are predicted based on age, VORP trajectory, playing time trajectory, etc.
The "Longevity" model incorporates individual and team performance (traditional and advanced stats), measurables (age, height, weight, etc), athletic abilities (NBA combine data), situation (teammate quality, competition, pace, position, playing time, era), and scouting (actual/expected draft rank). Additionally, the newest iteration of my model now includes metrics built from individual game logs. Individual game logs better capture information about how well a player performs against different levels of competition and/or playing style, which can be lost in the noise when simply looking at season averages (even if scaling by the strength of schedule and/or pace).
The model is trained on a data set of every college player over the last 25 years, reduced down to players with any NBA potential (as determined by NBA probability estimates, which are based on basic performance statistics). Players who never made the NBA are assumed to have replacement player value. Since playing styles have shifted greatly over the last 25 years, the performance of a player in a certain area is also measured about his peers from that season which helps make effectiveness in certain areas (i.e. 3's) more comparable across time. Lastly, the final model is a blend of many different individual models. The individual models consist of various machine learning algorithms (both linear and non-linear), all tuned in different ways.
We'd like to thank Jesse and Nick for their efforts and willingness to share and offer an invitation for others to join them when we renew this series of articles for the 2017 NBA Draft next spring. Here are the composite rankings color coded to help make everything a bit more clear (red is better, yellow is worse).
| Player | Nick | Jesse | DX Top 100 | DX Mock | Overall Average | Nick & Jesse Average | DX Average | |
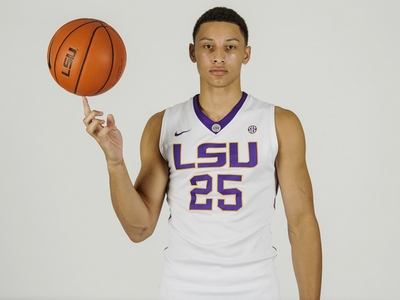
| Ben Simmons | 1 | 1 | 2 | 1 | 1.25 | 1.00 | 1.50 | |
| Brandon Ingram | 2 | 3 | 1 | 2 | 2.00 | 2.50 | 1.50 | |
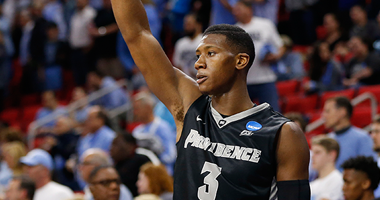
| Kris Dunn | 9 | 2 | 3 | 4 | 4.50 | 5.50 | 3.50 | |
| Jakob Poeltl | 6 | 4 | 7 | 8 | 6.25 | 5.00 | 7.50 | |
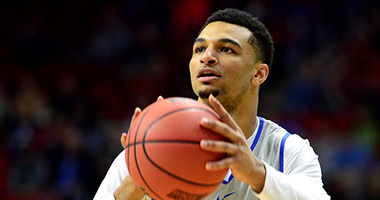
| Jamal Murray | 8 | 5 | 5 | 7 | 6.25 | 6.50 | 6.00 | |
| Jaylen Brown | 11 | 13 | 4 | 6 | 8.50 | 12.00 | 5.00 | |
| Henry Ellenson | 3 | 17 | 12 | 9 | 10.25 | 10.00 | 10.50 | |
| Deyonta Davis | 16 | 7 | 9 | 12 | 11.00 | 11.50 | 10.50 | |
| Tyler Ulis | 10 | 12 | 17 | 19 | 14.50 | 11.00 | 18.00 | |
| Marquese Chriss | 32 | 14 | 10 | 3 | 14.75 | 23.00 | 6.50 | |
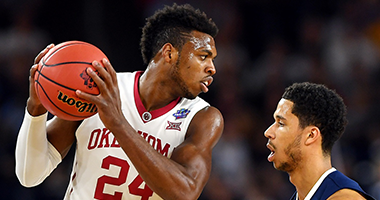
| Buddy Hield | 44 | 6 | 6 | 5 | 15.25 | 25.00 | 5.50 | |
| Demetrius Jackson | 21 | 15 | 14 | 13 | 15.75 | 18.00 | 13.50 | |
| Skal Labissiere | 30 | 16 | 8 | 10 | 16.00 | 23.00 | 9.00 | |
| Brice Johnson | 14 | 9 | 22 | 20 | 16.25 | 11.50 | 21.00 | |
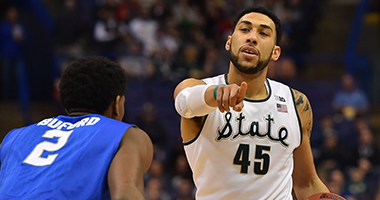
| Denzel Valentine | 28 | 10 | 11 | 18 | 16.75 | 19.00 | 14.50 | |
| Taurean Prince | 34 | 11 | 16 | 15 | 19.00 | 22.50 | 15.50 | |
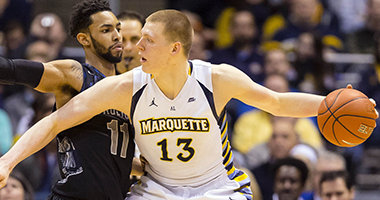
| Dejounte Murray | 4 | 25 | 24 | 25 | 19.50 | 14.50 | 24.50 | |
| Domantas Sabonis | 43 | 8 | 15 | 14 | 20.00 | 25.50 | 14.50 | |
| Malik Beasley | 18 | 22 | 19 | 23 | 20.50 | 20.00 | 21.00 | |
| Diamond Stone | 17 | 23 | 25 | 22 | 21.75 | 20.00 | 23.50 | |
| Cheick Diallo | 36 | 19 | 20 | 16 | 22.75 | 27.50 | 18.00 | |
| Malachi Richardson | 19 | 35 | 27 | 24 | 26.25 | 27.00 | 25.50 | |
| Damian Jones | 48 | 24 | 18 | 17 | 26.75 | 36.00 | 17.50 | |
| Chinanu Onuaku | 38 | 18 | 28 | 27 | 27.75 | 28.00 | 27.50 | |
| DeAndre Bembry | 60 | 21 | 21 | 21 | 30.75 | 40.50 | 21.00 | |
| Kay Felder | 7 | 34 | 41 | 41 | 30.75 | 20.50 | 41.00 | |
| Gary Payton II | 20 | 37 | 35 | 35 | 31.75 | 28.50 | 35.00 | |
| Isaiah Whitehead | 5 | 38 | 42 | 42 | 31.75 | 21.50 | 42.00 | |
| Malcolm Brogdon | 51 | 20 | 29 | 29 | 32.25 | 35.50 | 29.00 | |
| Pascal Siakam | 25 | 28 | 38 | 38 | 32.25 | 26.50 | 38.00 | |
| A.J. Hammons | 45 | 30 | 30 | 30 | 33.75 | 37.50 | 30.00 | |
| Robert Carter | 47 | 27 | 31 | 31 | 34.00 | 37.00 | 31.00 | |
| Ben Bentil | 41 | 31 | 32 | 32 | 34.00 | 36.00 | 32.00 | |
| Michael Gbinije | 26 | 32 | 39 | 39 | 34.00 | 29.00 | 39.00 | |
| Caris LeVert | 42 | 29 | 33 | 33 | 34.25 | 35.50 | 33.00 | |
| Patrick McCaw | 68 | 26 | 23 | 28 | 36.25 | 47.00 | 25.50 | |
| Anthony Barber | 15 | 54 | 40 | NR | 36.33 | 34.50 | 40.00 | |
| Stephen Zimmerman Jr. | 27 | 56 | 26 | NR | 36.33 | 41.50 | 26.00 | |
| Kyle Wiltjer | 12 | 43 | 56 | NR | 37.00 | 27.50 | 56.00 | |
| Dorian Finney-Smith | 13 | 49 | 43 | 43 | 37.00 | 31.00 | 43.00 | |
| Wade Baldwin IV | 55 | 48 | 13 | NR | 38.67 | 51.50 | 13.00 | |
| Jake Layman | 52 | 36 | 36 | 36 | 40.00 | 44.00 | 36.00 | |
| Georges Niang | 29 | 40 | 51 | NR | 40.00 | 34.50 | 51.00 | |
| Wayne Selden Jr. | 22 | 66 | 34 | NR | 40.67 | 44.00 | 34.00 | |
| Isaiah Briscoe | 40 | 42 | NR | NR | 41.00 | 41.00 | NR | |
| Perry Ellis | 23 | 51 | 50 | NR | 41.33 | 37.00 | 50.00 | |
| Marcus Paige | 24 | 55 | 48 | NR | 42.33 | 39.50 | 48.00 | |
| Prince Ibeh | 63 | 33 | 37 | 37 | 42.50 | 48.00 | 37.00 | |
| Jameel Warney | 37 | 50 | NR | NR | 43.50 | 43.50 | NR | |
| Sheldon McClellan | 33 | 52 | 45 | 45 | 43.75 | 42.50 | 45.00 | |
| Jarrod Uthoff | 50 | 41 | 44 | NR | 45.00 | 45.50 | 44.00 | |
| Yogi Ferrell | 31 | 58 | 47 | NR | 45.33 | 44.50 | 47.00 | |
| Isaiah Taylor | 46 | 46 | 49 | NR | 47.00 | 46.00 | 49.00 | |
| Josh Hart | 54 | 44 | NR | NR | 49.00 | 49.00 | NR | |
| Derrick Jones Jr. | 53 | 47 | 52 | NR | 50.67 | 50.00 | 52.00 | |
| Joel Bolomboy | 56 | 53 | NR | 44 | 51.00 | 54.50 | 44.00 | |
| Josh Adams | 64 | 39 | NR | NR | 51.50 | 51.50 | NR | |
| Shawn Long | 35 | 61 | 59 | NR | 51.67 | 48.00 | 59.00 | |
| Danuel House | 39 | 68 | NR | NR | 53.50 | 53.50 | NR | |
| Troy Williams | 49 | 59 | 54 | NR | 54.00 | 54.00 | 54.00 | |
| Damion Lee | 59 | 65 | 46 | NR | 56.67 | 62.00 | 46.00 | |
| Fred VanVleet | 67 | 45 | 60 | NR | 57.33 | 56.00 | 60.00 | |
| Ron Baker | 57 | 57 | 58 | NR | 57.33 | 57.00 | 58.00 | |
| James Webb | 62 | 60 | 53 | NR | 58.33 | 61.00 | 53.00 | |
| Zach Auguste | 58 | 63 | 57 | NR | 59.33 | 60.50 | 57.00 | |
| Julian Jacobs | 61 | 62 | 62 | NR | 61.67 | 61.50 | 62.00 | |
| Alex Caruso | 65 | 64 | 61 | NR | 63.33 | 64.50 | 61.00 | |
| Wes Washpun | 66 | 67 | NR | NR | 66.50 | 66.50 | NR |
Notes: The Mock Draft list only has 45 prospects eligible for this exercise. The overall top 100 prospect list only had 62.
Read Next...
-
Comparing and Contrasting the Prospects of Tatum, Jackson and Isaac
Jun 21, 2017, 02:52 pmIn a draft class lauded for its guards, three exceptionally talented, and wildly different, forward prospects sit in the top six of our mock draft, each taking a very different path to the top, and demonstrating wildly contrasting strengths and weaknesses. So who is the best prospect among the three? -
De'Aaron Fox Catalyst Sports Pro Day Workout
Jun 21, 2017, 10:49 amVideo from the De'Aaron Fox Catalyst Sports Pro Day Workout in Los Angeles. Video produced by Matt McGann.



























Comments