


Paul Gearan
Heather N. Allen, Ph.D.
The safest bet in sports history has to have been the sophomore team taking down the rookies in last Fridays NBA All-Star Challenge. It was indeed kind of the rookie squad not to ruin this articles lead (or impede the inaugural David Lee Dunk til You Drop Festival), but to give up and lose by the most points in this exhibition games history - that was truly icing on the cake. Honestly, though, did anyone expect anything else from what is shaping up to be one of the worst performing rookie draft classes of all time?
It is no secret that the 2006 draft was thought to be the weakest in years. It was most likely the weakest since at least 2000 when Kenyon Martin went first and...well, it really doesnt matter much after that. There were several reasons for the poor showing in 2006. This was the first year since 1994 without high school kids, the college talent pool was thin due to players entering early in 2005 to ensure that new age requirements did not snare them in 2006, and the international pool was fairly humble.
Draft night itself seemed a lackluster affair. We dont think any Hawks fans leapt out of their chairs exclaiming Sheldon Williams! Now were on our way to a title! Some teams at least tried to break the monotony with apparent transient psychotic episodes - the Sonics, for example, must have really loved Saer Sene blocking all those high school kids shots in last years Nike Hoop Summit. But in retrospect, can you really blame the Sonics? Those who immediately followed have not exactly stormed the NBA Bastille: JJ Redick, Hilton Armstrong (a career back-up at UConn until his senior year goes at 12!), Thabo Sefolosha (a 22-year old international player), Ronnie Brewer, Cedric Simmons, and on and on . Theres some potential there, but we doubt there are too many Sonics executives tossing in their beds as they lament passing up Quincy Douby.
While it is obviously way too early to definitively evaluate the long-term value of the 2006 draft (see below the dramatic turns some draft classes have taken over time), one thing is fairly certain: unless several of these guys soon wake to the whisper of Save the Cheerleader, Save the NBA and realize basketball powers heretofore not displayed, this will remain one of the weakest rookie classes in modern NBA history.
Profile of 2006 Draft Class Rookies to Date
How bad is it? One could make an argument that Craig Smith and Paul Millsap (the 36th and 47th picks, respectively) have been the best performing rookies this year, given the minutes that theyve played. At the All-Star break, their per-48-minute efficiency ratings (according to NBA.com) are the highest in the league among rookies playing in at least 30 games and averaging 15 minutes or more. Even without adjusting for minutes played, Millsap (at an efficiency of 9.86) trails only Jorge Garbajosa (11.30; yeah, were sorry but undrafted 29-year-olds with a decade of international play do not count as rookies; scratch Garbajosa from this analysis) and Brandon Roy (14.88), who missed 20 games due to injury. Roy, as many expected, has proven himself the most NBA-ready of the rookie class, showing both an ability to score and having a nicely balanced game. There is a veritable canyon, however, between Roys performance and that of the rest of the rookie pack.
As for the other draft stars those other top 10 picks? Adam Morrison was the likely Rookie of the Year by default before Roys return. But Morrisons season has mainly played out as his critics had feared, proving him to be an extremely one-dimensional player (a scorer). Unfortunately, he has not even performed very well at that one dimension. In 32 mpg, the 68 Morrison has averaged only 3.2 rebounds and has blocked a total of 5 shots over 52 games. So hes a perimeter player - a perimeter player averaging only 2.2 assists a game and turning the ball over at nearly the same rate (1.8). Whats more, for a scorer, 38% from the field, 31% from the three, and 71% from the line hardly takes your breath away. If he was not playing for one of the five worst teams in the NBA, his backside would certainly be firmly planted on the bench by now.
Given the uncertainty of young international players immediate ability to play, Andrea Bargnani has to be considered a qualified success, especially if you like 7-footers who attempt more threes (191) than they grab rebounds (177). Hes gone over 20 points three times this season, and against the Warriors on December 17th he had 18 points, 10 rebounds, and 6 blocked shots. He can shoot: 36% from three and 84% from the foul line. Paired with his 10.6ppg, 3.5rpg, and 0.8 bpg this is probably enough to exorcise any lingering images of Darko Volume II for Raptor fans. Nonetheless, with an efficiency rating of only 9.04, hes on par with the worst number one picks of the past 27 years. In fact, the only number one pick with a worse rookie efficiency rating was 2001s Kwame Brown (and as the first high school kid ever picked at number one, Kwame at least had youth on his side).
Modest is the most fitting description of the contributions of the other top picks at the break. LaMarcus Aldridge has had his moments for the Trailblazers (6.8ppg, 4.0rpg, and 1.0bpg in 19.3mpg) and Tyrus Thomas has been a small contributor for the Bulls (3.6ppg, 2.9rpg, and 1.0bpg in 10.7mpg). The aforementioned Shelden Williams is as advertised: unspectacular but solid (5.3ppg, 5.5rpg, and 0.5bpg in 19.3mpg). Randy Foye keeps teasing Wolves backers with sporadic nice games: a 25-point effort versus the Bulls in late September and another against Phoenix in January, a few 5+ assist games sprinkled throughout the year. But overall his 9.0ppg, 2.4apg, 2.7rpg, and 43% shooting (although a respectable 35% from the three and 84% from the line) in 21mpg are not the stuff of top flight rookies - particularly those who are 23-year-olds with four years of college experience. Rudy Gay went into the break in style with a season-high 31 points against Indiana, marking a general pattern of improved play in February which has started to pull up the downright unsightly numbers that he put up over the first 3 months of the season. Gay is now at 43% from the field, 38% from three, and 68% from the line, but still has more turnovers than assists (1.3/1.0). His saving grace is that he rebounds a little (3.9), and gets the occasional block (0.9) or steal (0.9).
And what about Patrick OBryant and Saer Sene (picks 9 and 10)? Rumor has it that most of their teammates could not pick either out of a line-up. They have played a combined 192 minutes over the first half of the season, and have shot a combined 15 for 47 (32%) from the field (and they aint taking Bargnani threes) in their limited action. Other than Oleksiy Pecherov and Joel Freeland, both of whom have not matriculated to the NBA yet, Maurice Ager (28th pick by Dallas) is the only rookie first round pick to have played fewer minutes than Sene and OBryant this year. In fact, thirteen second round picks have played more minutes than either of these guys, as well as several undrafted free agents, including Allan Ray, Chris Quinn, and Tarence Kinsey.
Comparison of Draft Classes
In order to get a better sense of how this year stacks up against the past 26 drafts, we created a novel production metric based upon the NBA Efficiency score. The purpose of this calculation, referred to as the Adjusted Efficiency Score, is to estimate the total seasonal production for each entire draft class while factoring in seasonal pace differences.
In order to calculate the Adjusted Efficiency Score, each active players NBA Efficiency score for the relevant year is first adjusted for that seasons overall league pace in order to make each year comparable to 2006. This number is then divided by the number of possible games in a year (82 except for the strike-shortened 1998 year, in which case the divisor was 50) and by the number of positions in the first and second round of the draft in which the player was chosen (this factor varies between 46 and 60 depending on the year)*. The sum of these calculations across an entire draft class then yields the Adjusted Efficiency score for each draft class.
The draft year Adjusted Efficiencies below (Table 1) thus factor in both the percentage of draftees active in a given year (thus years with fewer players who made it to the NBA will have a lower score) and the number of games played by those draftees (thus a player who had 1 very good game will have a lower score than a player who had 50 average games) in each season.
Although prior to 1989 there were more than two rounds in the draft (starting with ten in 1980 and going down to three in 1988), only players drafted in the first two rounds were included in this analysis in order to allow for better comparisons across years.
When considered as a whole, the draft class of 1981 (with numerous strong players, led by Isiah Thomas and Larry Nance, and including Buck Williams, Jay Vincent, and Kelly Tripucka) had both the best first and third year production. By their fifth year, they were producing third overall, behind the classes of 1985 (Karl Malone, Patrick Ewing, and others) and 1987 (David Robinson, Scottie Pippen, Horace Grant).
More to the point for the present article, the class of 2000, the class that most resembles the current class, was far and away the worst performing draft class in both its first and third year. By their fifth year of play, only the classes of 1997 and 1980 had sunk below the class of 2000 in production.
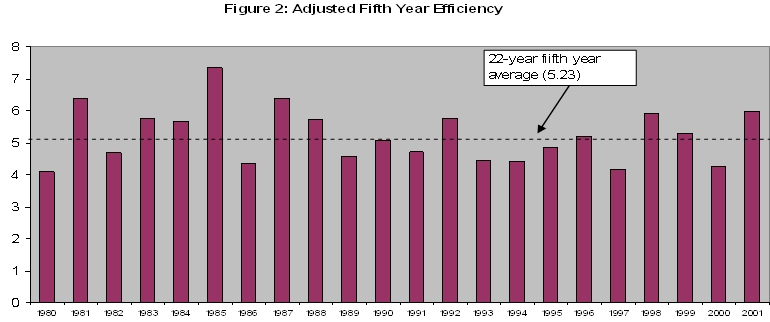
1997, you ask? How can any class that produced Tim Duncan be considered one of the all-time worst? Consider this: in the average draft class, 22% of first round draftees can be found warming their living room couches five years later. For the class of 1997, that number was 36%. Compare that to the class of 1988 (admittedly, a year without superstars), in which only three players (12%) were out of the league five years later (and a whopping 40 of 58 total draftees were still in the league). Whats more, 1997 only produced five players (18%) who were solid starters or better five years later. The average draft class sees more than double that percentage (38%). All of this is reflected in the class of 1997s extremely low Five Year Adjusted Efficiency of 4.17. Ten draft classes actually performed better in their rookie years than the class of 1997 did after five years in the NBA.
While not the very worst in average five year player performance, the class of 2000 offered up pretty lackluster outcomes. The class of 2000 produced no superstars, and only one All-Star caliber player (our friend Kenyon Martin and with only one All-Star appearance to his credit, even calling him an All-Star is kind). Whats more, by their fifth year, the class of 2000 was averaging only 55 games of playing time and a meager 24 minutes per game. This is reflected in the weak class Adjusted Efficiency rating of 4.27. Compare this to the amazing class of 1985 (Adjusted Efficiency of 7.34) which boasted three superstars (Patrick Ewing, Karl Malone, and Chris Mullin), and four other All-Star caliber players, saw 62% of its first and second round picks still in the league in year five, and were averaging 65 games of play at 29 minutes per game by their fifth year out.
The draft class of 2006 is well on its way to the bottom of the chart (Figure 1). At this point in the season (with teams having played an average of 52 games), they are surpassing only the aforementioned abysmal class of 2000 and the nearly-as-bad class of 2002. While the class of 2002 did boast superstars Yao Ming and Amare Stoudemire, average rookie production was quite poor. In 2002, a below-average number of draftees made it onto an NBA roster in the year of their draft, and those that did make a roster played among the fewest games and minutes per game of any draft class in the past 27 years.
The reduced first year efficiency observed over the past ten years in Figure 1 is most likely due to the large number of high school players (and college freshmen and sophomores) who came out in the past decade as compared to the previous 15 years. Younger players are typically not quite as NBA-ready in their first year as are their older counterparts. Of course, this is no excuse for the class of 2006, the first class without high school players since 1993. Whats more, the only thing saving this current crop of players from an even darker place in NBA history is the relative strength of its second round picks (paging Smith and Millsap ). While the current crop of first round draftees has the worst rookie production of all of the 27 first round classes measured (worse even than that awful class of 2000), the second rounders are holding their own, coming in 12th out of the 27 classes and producing at about the second round average.
What can we expect in the future from the class of 2006? Well, fifth year efficiency does generally show a more stable pattern over time (i.e. there is no drop seen over the past decade as there is in the first year numbers) with a few particularly good years (1985 being the best) and a couple of poor ones (those mentioned above with the notable addition of 1980 which looked much worse five years later [22nd] than it did the first year after the draft [6th]). Offering a small ray of hope for the class of 2006 is the fact that there is substantial movement among several of the draft classes: some that appeared very weak in year 1 are much stronger in year 5 (1987 [partly due to David Robinson not playing until 3 years after the draft due to his military commitment], 1998, 1999, and 2001) and conversely, some that started out strong faded substantially by the fifth year after the draft (1980, 1986, 1994).
Boding poorly for this years rookie class are its many similarities with the infamous draft class of 2000: an athletic LSU underclassman power forward drafted in the top 4, sparse representation of high school players (only Darius Miles [#3] and DeShawn Stevenson [#23] in 2000), weak international representation, and cries of really? and who? from about the 9th pick on (what Celtics fan does not recall their spit-take when Jerome Moisos name was called at #11 in 2000?). Both 2000 and 2006 seem to lack the kind of upside that the drafts of 1998, 1999, and 2001 enjoyed: the presence of several high school players, freshmen, and young international players who typically take a while to flourish in the NBA. The draft class of 2006 has a few such players Bargnani, Aldridge, Thomas, Sene, and Shawne Williams most notably but not a lot.
Whos ready for the class of 2007?
*Adjusted Efficiency = [((Pts + Reb + Asts + Stl + Blk) - ((fga - fgm) + (fta - ftm) + turnover))*(90.5/lgpace)]/#draftslots/#games.
Lgpace = Average pace of the NBA for each year as reported by basketball-reference.com
#draftslots = number of first and second round draftees in a given draft year
#games = number of possible games in a year (82 for all years except the strike year of 1998-99)
Note: Data for this article was compiled from NBA.com, Basketball-Reference.com, NBADraft.net, DatabaseBasketball(2.0), and TheDraftReview.com. The authors would like to thank all those involved with developing and maintaining those resources and making them available for public use.


Comments